Every metric. Every pattern. Every next step. Instantly clear.
AI that turns CX data into direction
Kustomer combines your reporting with AI to summarize what's happening, call out anomalies, and recommend next steps for staffing, coaching, and process.
Schedule Demo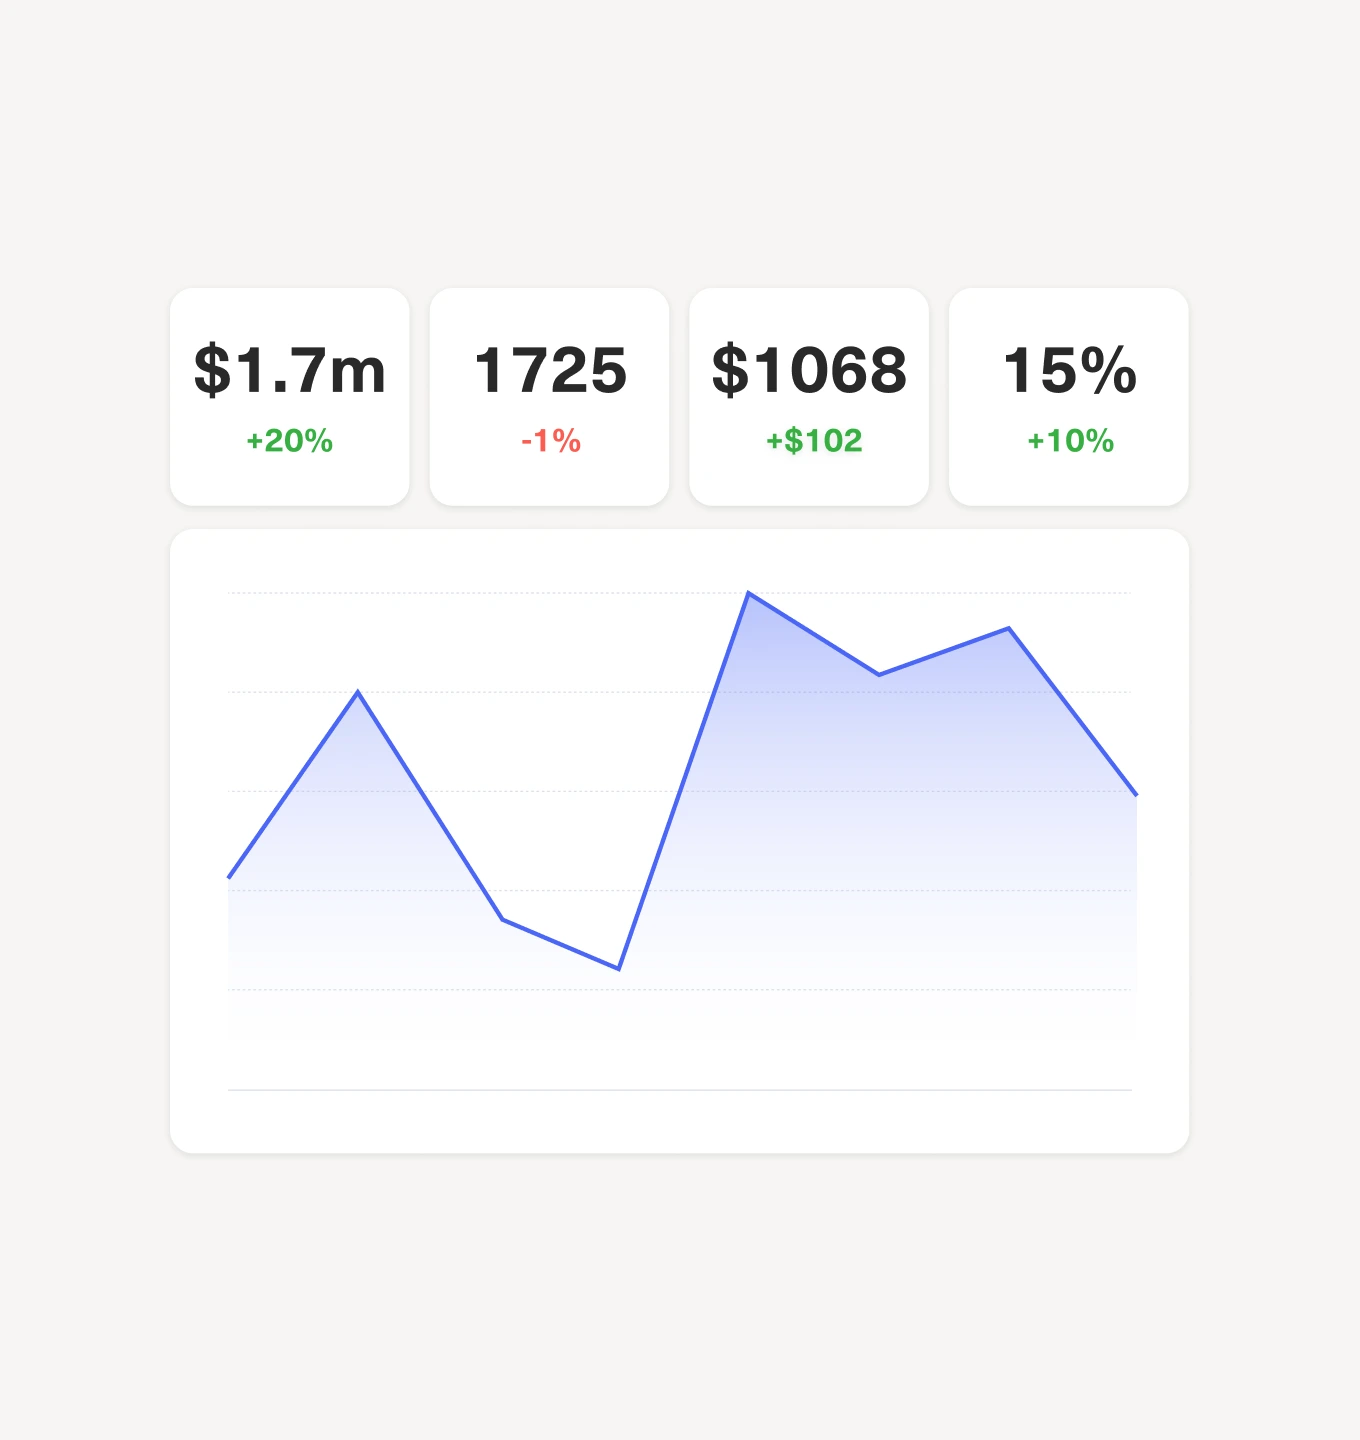
Turn scattered metrics into a clear performance story
Bring queues, channels, and team metrics into one view so you can quickly see how your CX operation is performing, spot what’s driving changes, and share a story your leadership can trust.
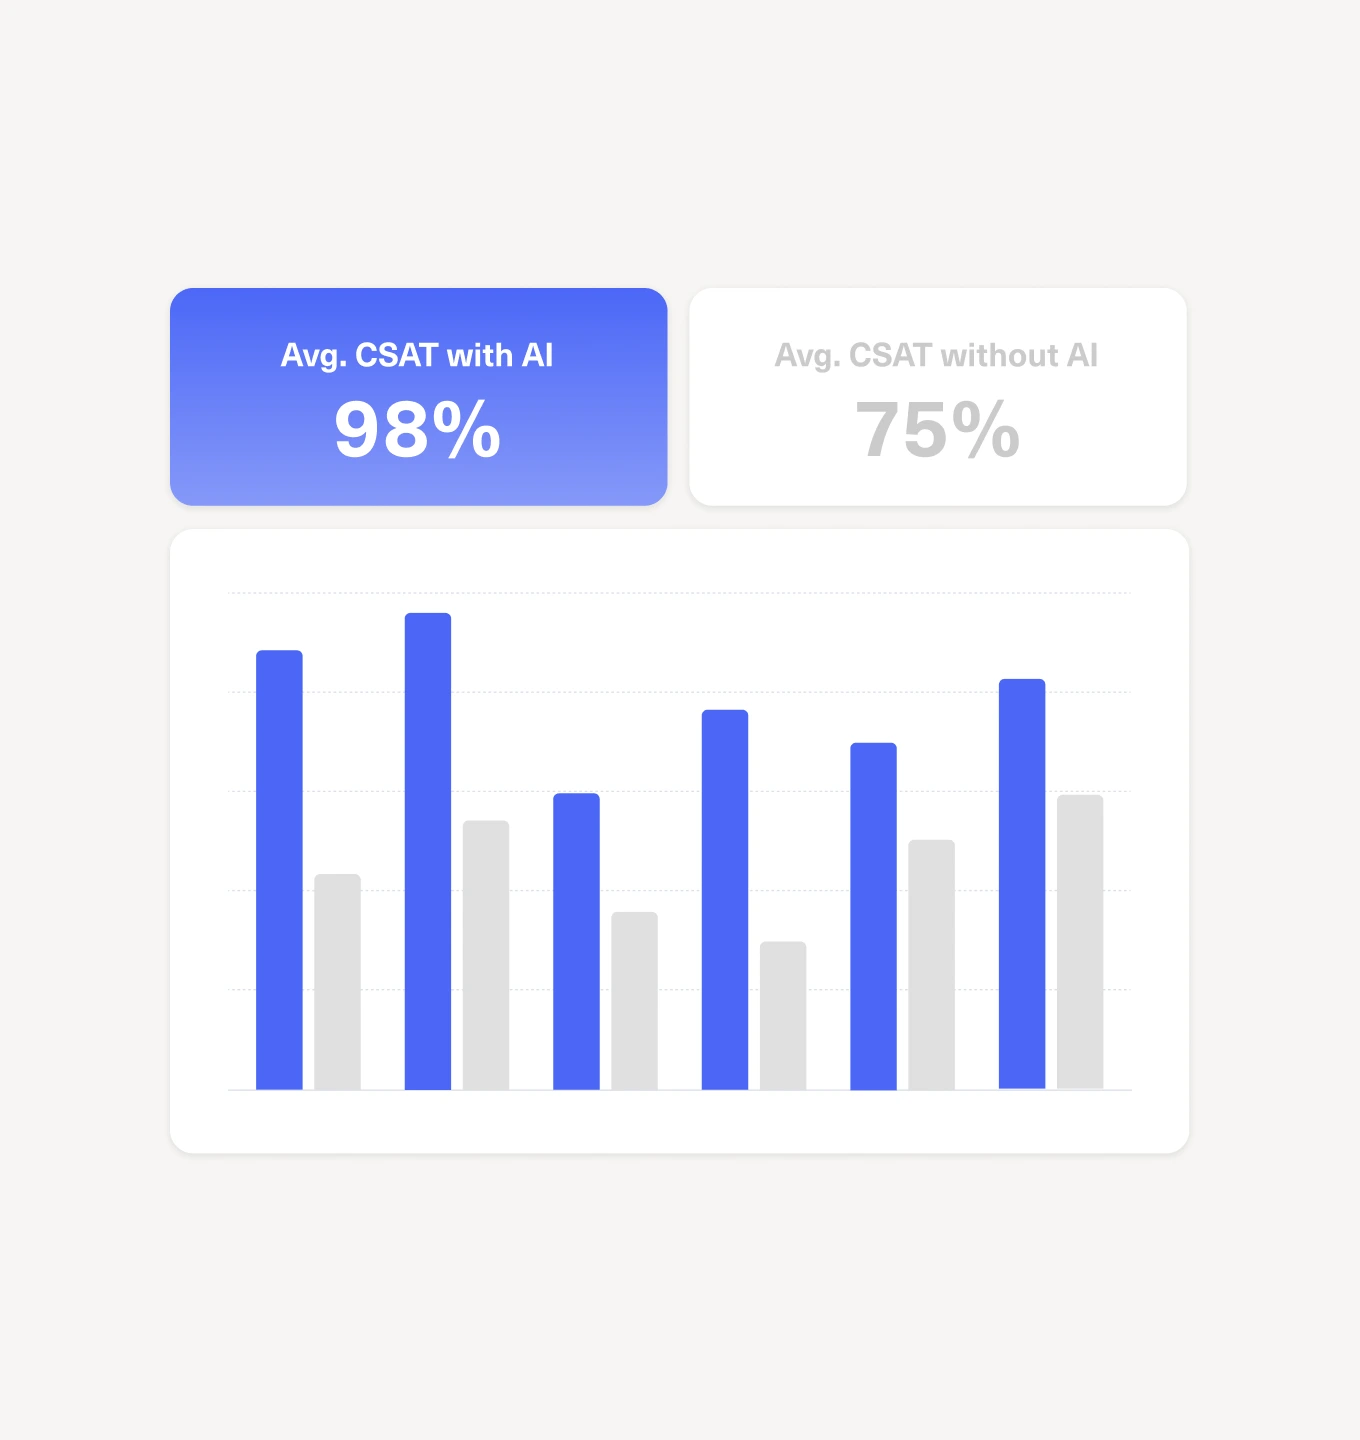
Monitor and optimize AI for both CSAT and efficiency
Track how AI is handling conversations, deflecting volume, and impacting resolution times and CSAT, so you can fine-tune where AI steps in, where humans should lead, and how to get the best blend of cost and experience.
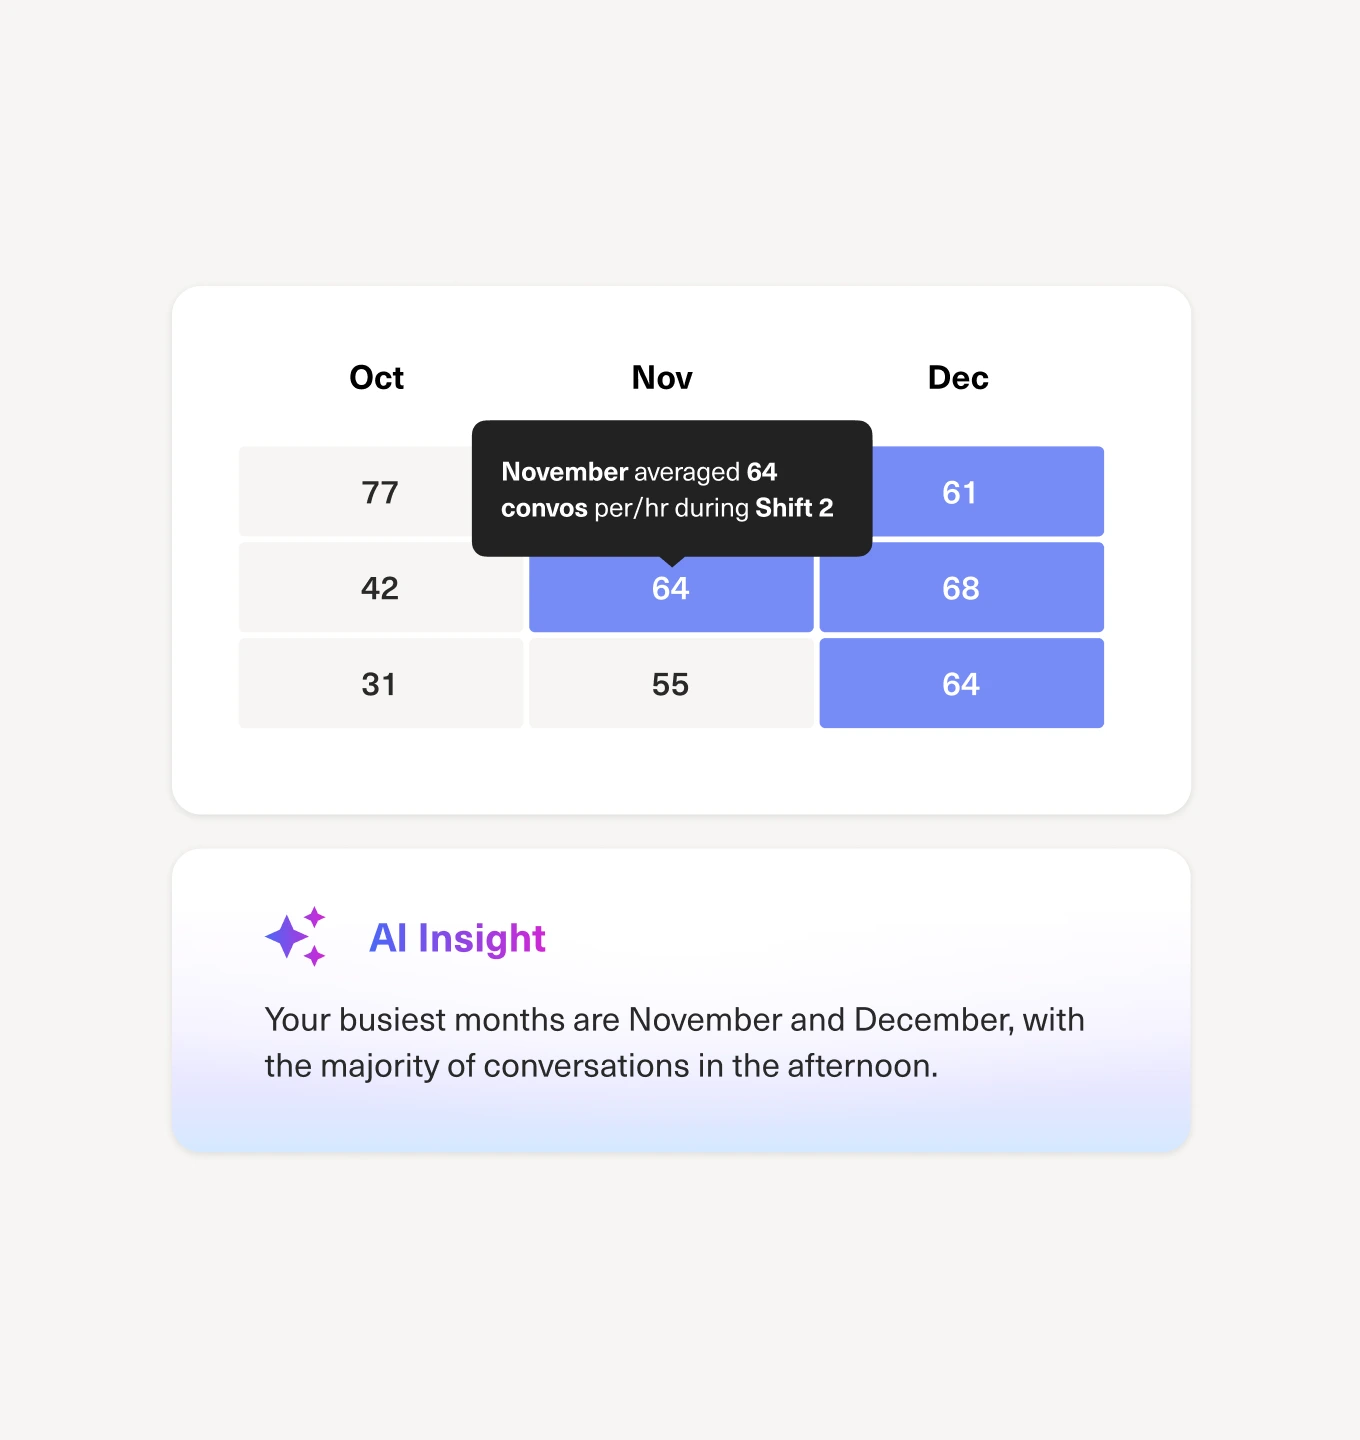
Turn insights into staffing, coaching, and process decisions
Go beyond “what happened” to understand which teams are struggling, where backlogs form, and which workflows need attention, then use those insights to adjust schedules, refine routing, and coach agents with confidence.
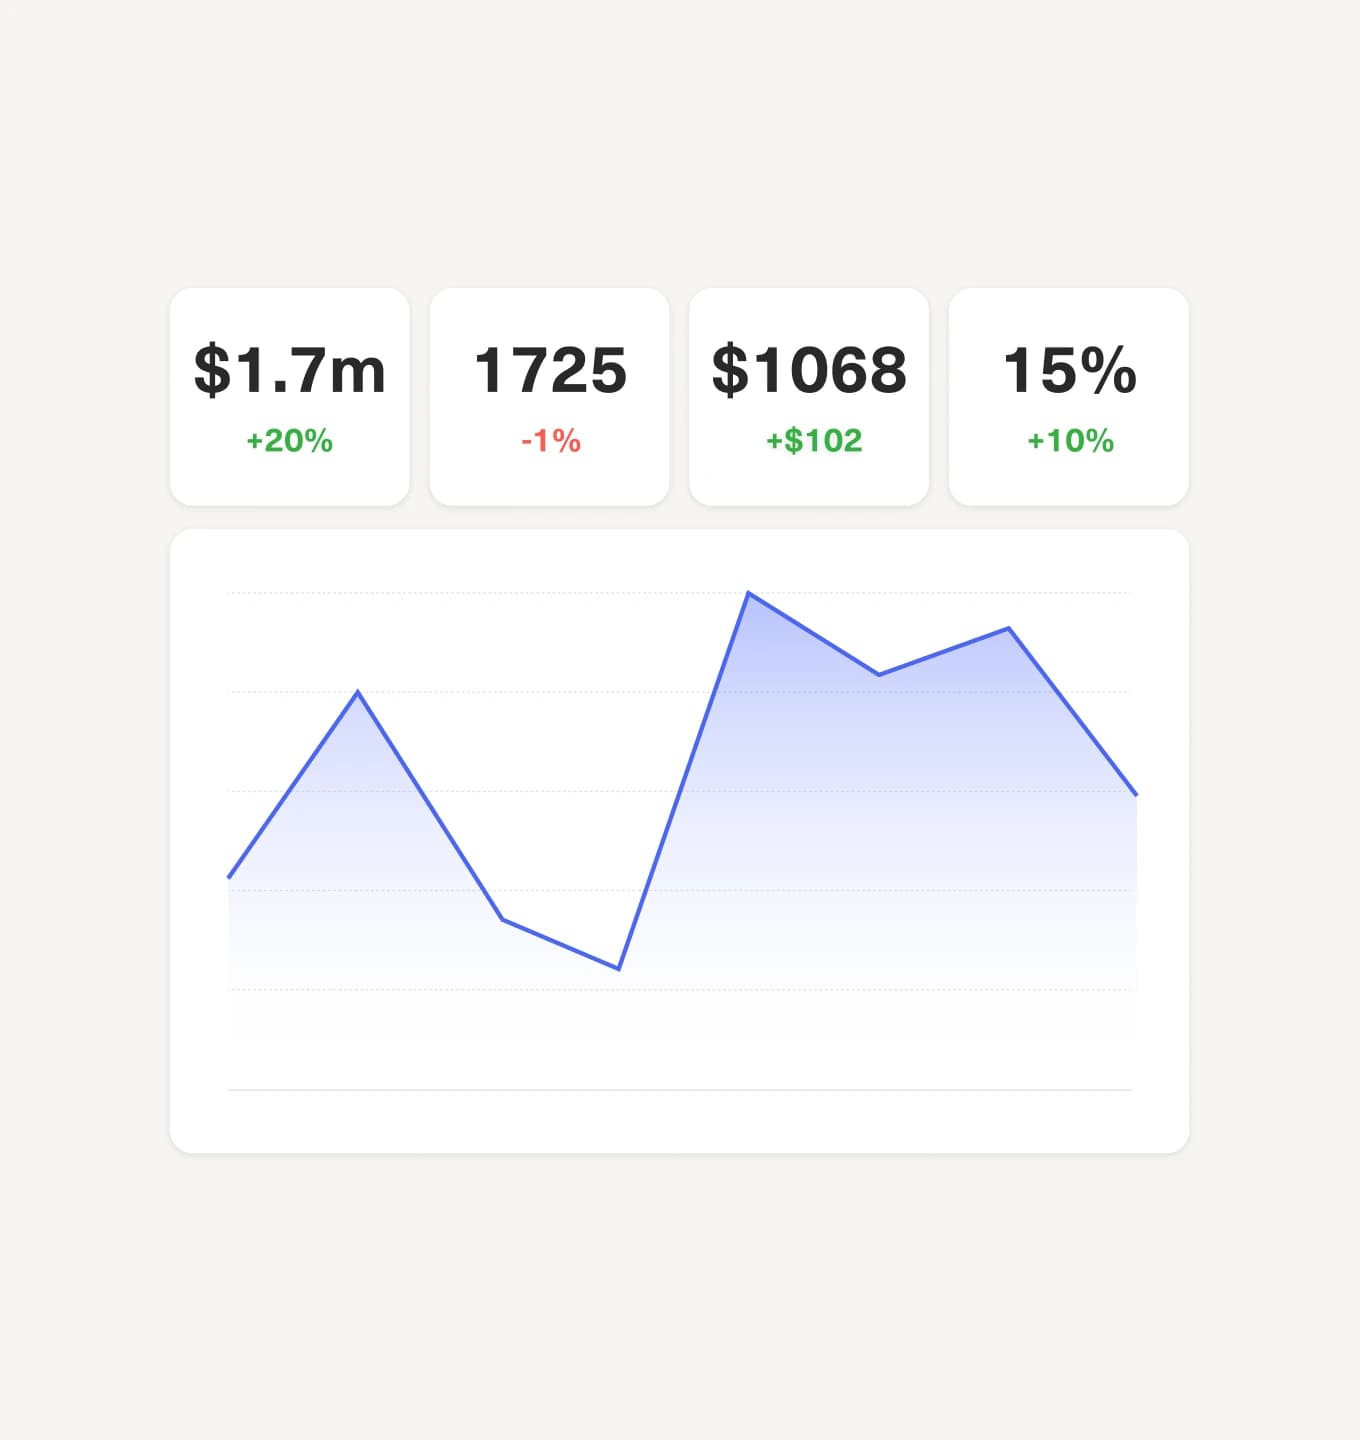
Turn scattered metrics into a clear performance story
Bring queues, channels, and team metrics into one view so you can quickly see how your CX operation is performing, spot what’s driving changes, and share a story your leadership can trust.

“The new Data Explore feature in Kustomer has quickly become one of my favorite tools. It gives me the ability to deep-dive into any metric I need, which has made my analysis faster, more accurate, and far more actionable.”
Marissa Sherwood
Senior Manager of Customer Experience


Clarity in the data, confidence in the boardroom
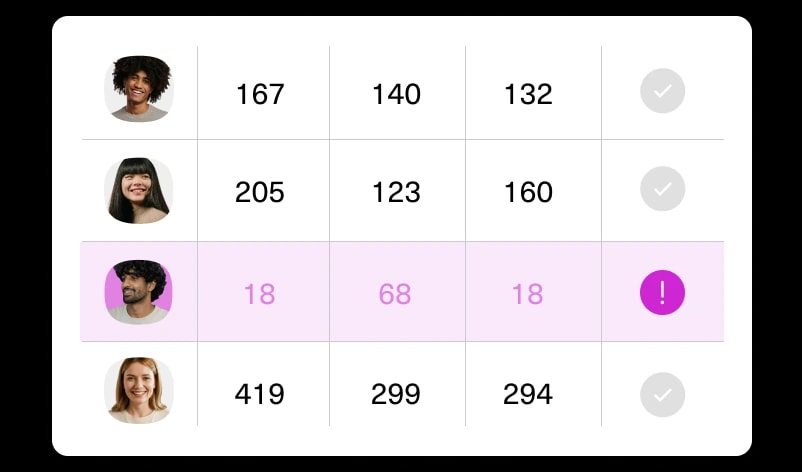
Schedule DemoReal-time visibility into every team
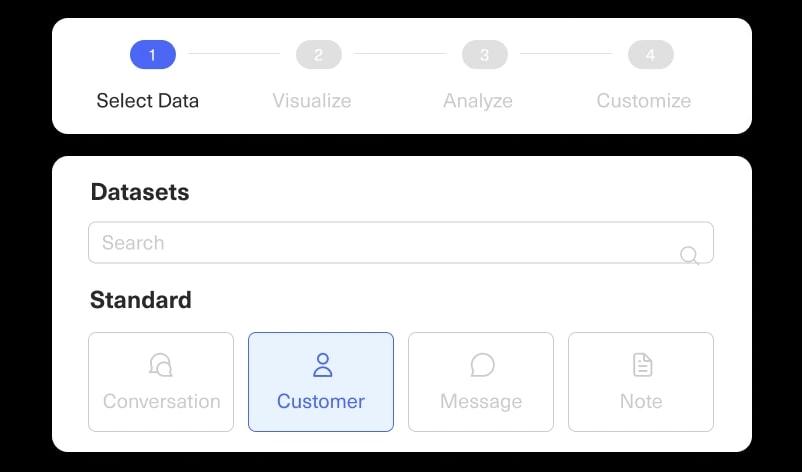
Build the exact reports your leaders want
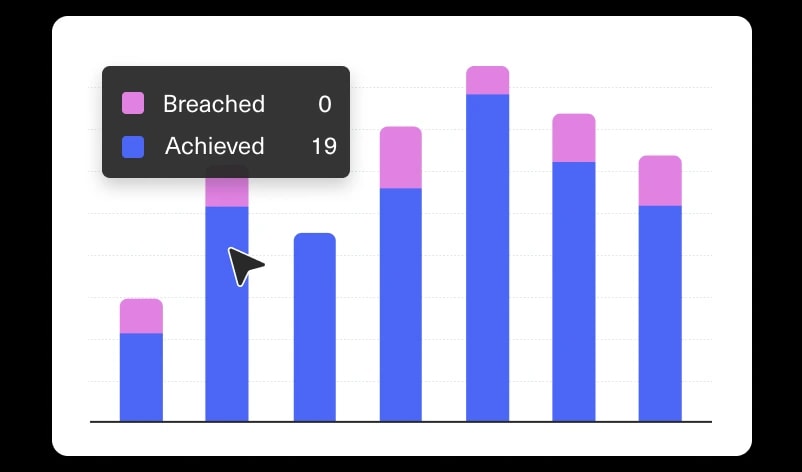
Instant visibility into SLA performance
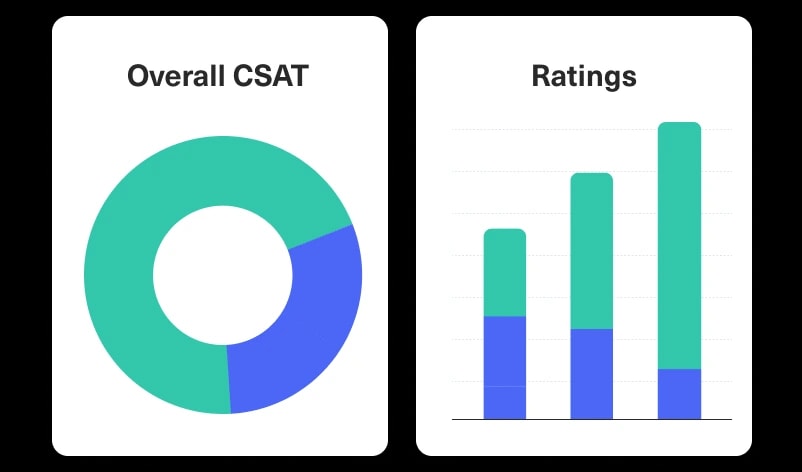
See how customers really feel, in real time
Questions in, explanations and next steps out
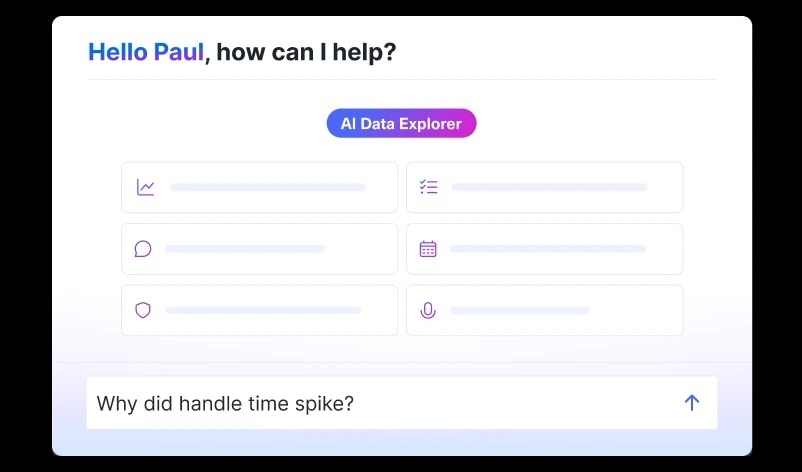
Out-of-the-box dashboards for everyday answers
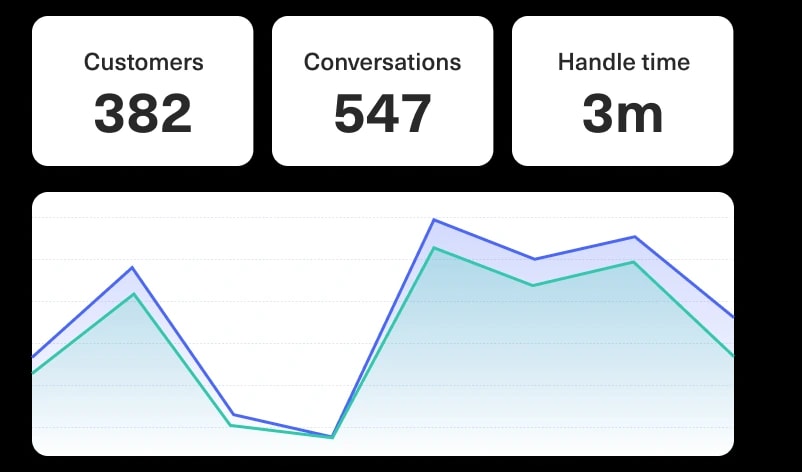

Data that lets you lead, not guess
With trusted data, clear visuals, and explanations behind every trend, Kustomer helps CX leaders steer the operation, justify investments, and highlight wins.
Trusted by CX leaders across multiple industries