Instead of partridges, turtle doves, and golden rings, this year CX leaders get something much better: 12 powerful prompts that unlock clarity, trust, and operational magic inside Data Explorer.
Data Explorer is Kustomer’s new game-changing analytics tool. See how it works:
Now let’s dig into the prompts that will help you get started with this powerful tool.
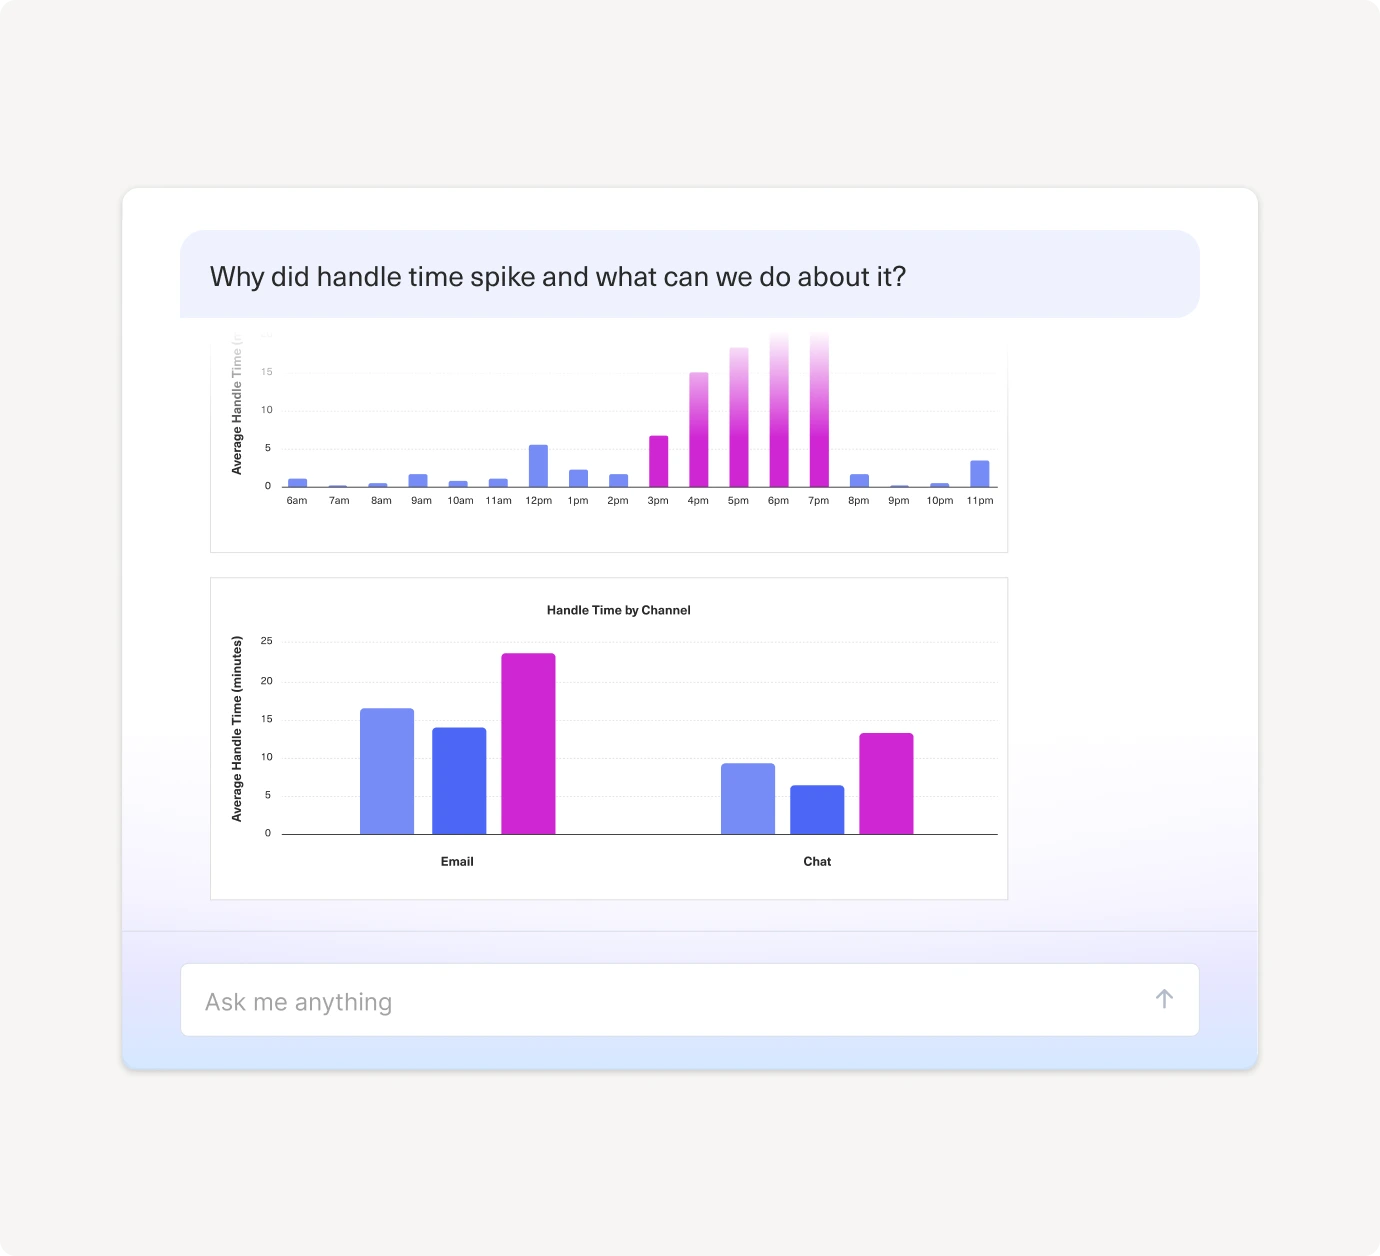
Day 1: “Why did handle times spike?”
Prompt:
“Why did handle times spike this month, week, or quarter?”
What Data Explorer gives you:
- A breakdown of what changed across channels, sentiment, queue saturation, and case types
- Clear explanations of the underlying drivers behind rising handle times
- Recommendations to address the issue — such as staffing adjustments or changes in routing or prioritization
Why it’s helpful:
Handle time spikes often trigger operational fire drills. This prompt identifies exactly what shifted so leaders can focus on the true drivers instead of sifting through multiple reports or relying on guesswork.
Business impact:
- Saves hours otherwise spent diagnosing the issue
- Helps prevent SLA risks by spotting problems early
- Supports more confident, data-backed decisions for both immediate and long-term improvements
Pro Tip:
Add a follow-up like “Which queues contributed most to the spike?” to pinpoint where to take action first.
Day 2: “Show me my team’s performance scorecards”
Prompt:
“Show me my team’s performance scorecards for this month.”
What Data Explorer gives you:
- Auto-generated scorecards for every rep, updated with the latest performance data
- Insights into strengths, gaps, and coaching opportunities
- Clear explanations of what’s driving performance and where support is needed
Why it’s helpful:
Instead of manually pulling metrics for one-on-ones or coaching sessions, leaders get a complete, ready-to-use view of each rep. It highlights what matters most so managers can focus their time on coaching, not compiling data.
Business impact:
- Saves hours of manual analysis every week
- Improves coaching effectiveness with targeted insights
- Helps leadership spot trends across the team and take action sooner
Pro Tip:
Follow up with “Show me which agents improved the most this month” to spotlight progress and identify developing strengths.
Day 3: “What changed? Show me anomalies.”
Prompt:
“What changed this month, week, or quarter? Show me anomalies.”What Data Explorer gives you:
- A scan across your key metrics to surface unexpected shifts in volume, backlog, sentiment, handle time, or SLAs
- Clear explanations of what moved and why it matters
Context around the operational impact so leaders immediately understand the significanceWhy it’s helpful:
Instead of hunting through dashboards to find out what changed, this prompt highlights the biggest movements automatically. Leaders get a real-time view of emerging issues or opportunities without manual investigation.Business impact:
- Quickly identifies risks before they affect customers
- Helps leaders respond proactively instead of reactively
- Provides a clearer understanding of trends that shape planning and prioritization
Pro Tip:
Ask “Which anomalies had the biggest impact on customer experience?” to focus on the changes that matter most.
Day 4: “Which customer issues are driving the most refunds?”
Prompt:
“Which customer issues are driving the most refunds this month, week, or quarter?”
What Data Explorer gives you:
- Instant visibility into the top drivers of refund requests across issues, SKUs, channels, or policies
- Clear explanations showing which patterns are contributing most to refund volume
- Insights that help teams trace problems back to product, operational, or policy-related causes
Why it’s helpful:
Refunds are costly — but identifying their root causes is often manual and time-consuming. This prompt pinpoints exactly where customers are running into problems so leaders can reduce frustration, prevent repeat issues, and improve product or policy decisions.
Business impact:
- Reduces unnecessary refunds by addressing recurring drivers
- Highlights product or process gaps that need attention
- Improves customer satisfaction by resolving the issues that matter most
Pro Tip:
Follow up with: “Show me refund trends by SKU” or “Which issues increased the most this month compared to last?” to get deeper product-level clarity.
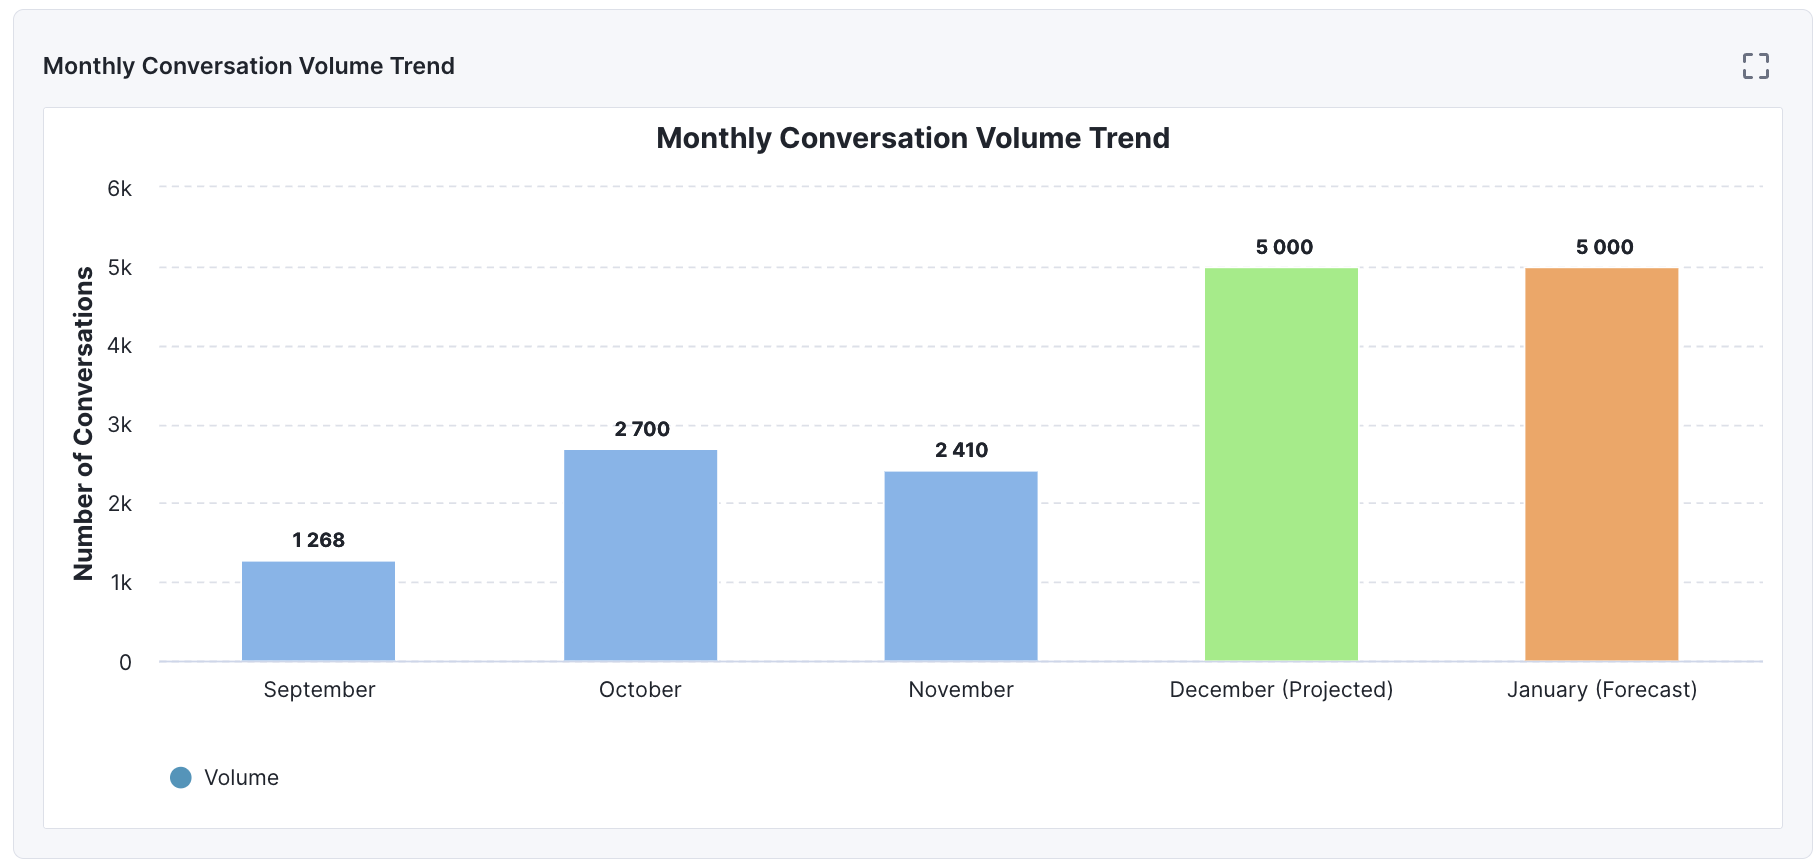
Day 5: “Forecast next month’s contact volume.”
Prompt:
“Which customer issues are driving the most refunds this month, week, or quarter?”
What Data Explorer gives you:
• Instant visibility into the top drivers of refund requests across issues, SKUs, channels, or policies
• Clear explanations showing which patterns are contributing most to refund volume
• Insights that help teams trace problems back to product, operational, or policy-related causes
Why it’s helpful:
Refunds create real cost and often signal deeper issues, but uncovering the causes usually requires manual digging. This prompt immediately surfaces the customer problems behind refund spikes so leaders can address them before they escalate.
Business impact:
• Reduces unnecessary refunds by resolving recurring drivers
• Highlights product or policy gaps that need attention
• Improves customer satisfaction by fixing the issues customers experience most often
Pro Tip:
Follow up with “Show me refund trends by SKU” or “Which issues increased the most this month?” to get sharper product-level insight.
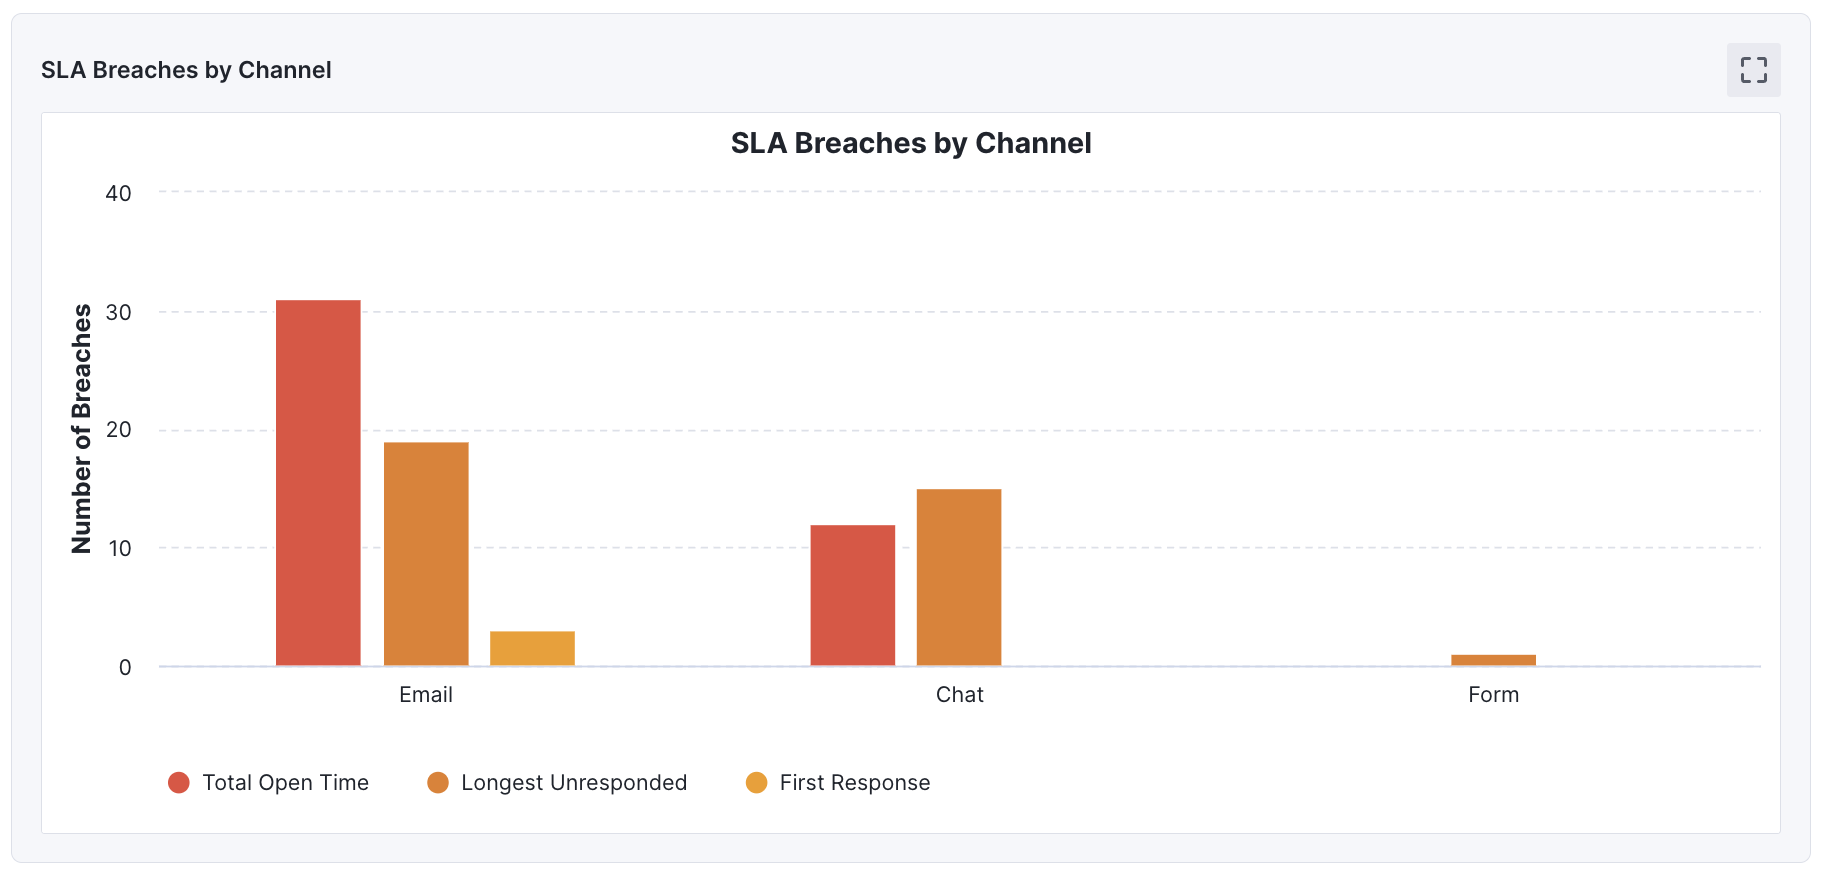
Day 6: “Where are we missing SLAs?”
Prompt:
“Where are we missing SLAs this month, week, or quarter?”
What Data Explorer gives you:
• A clear view of which teams, queues, or time periods are falling below SLA targets
• Explanations that show what changed and what is driving the dip
• Context that helps leaders understand the scale and impact of the issue
Why it’s helpful:
Missed SLAs can signal rising volume, staffing pressure, or drops in performance, but spotting the pattern across reports is often slow. This prompt highlights exactly where service slipped and why, giving leaders a direct path to resolution.
Business impact:
• Prevents small service issues from becoming larger customer problems
• Helps leaders take timely action to restore service levels
• Strengthens customer trust by improving consistency of support
Pro Tip:
Ask “Which queues or hours contributed most to SLA misses?” to narrow in on the biggest drivers.
Day 7: “What’s impacting CSAT the most?”
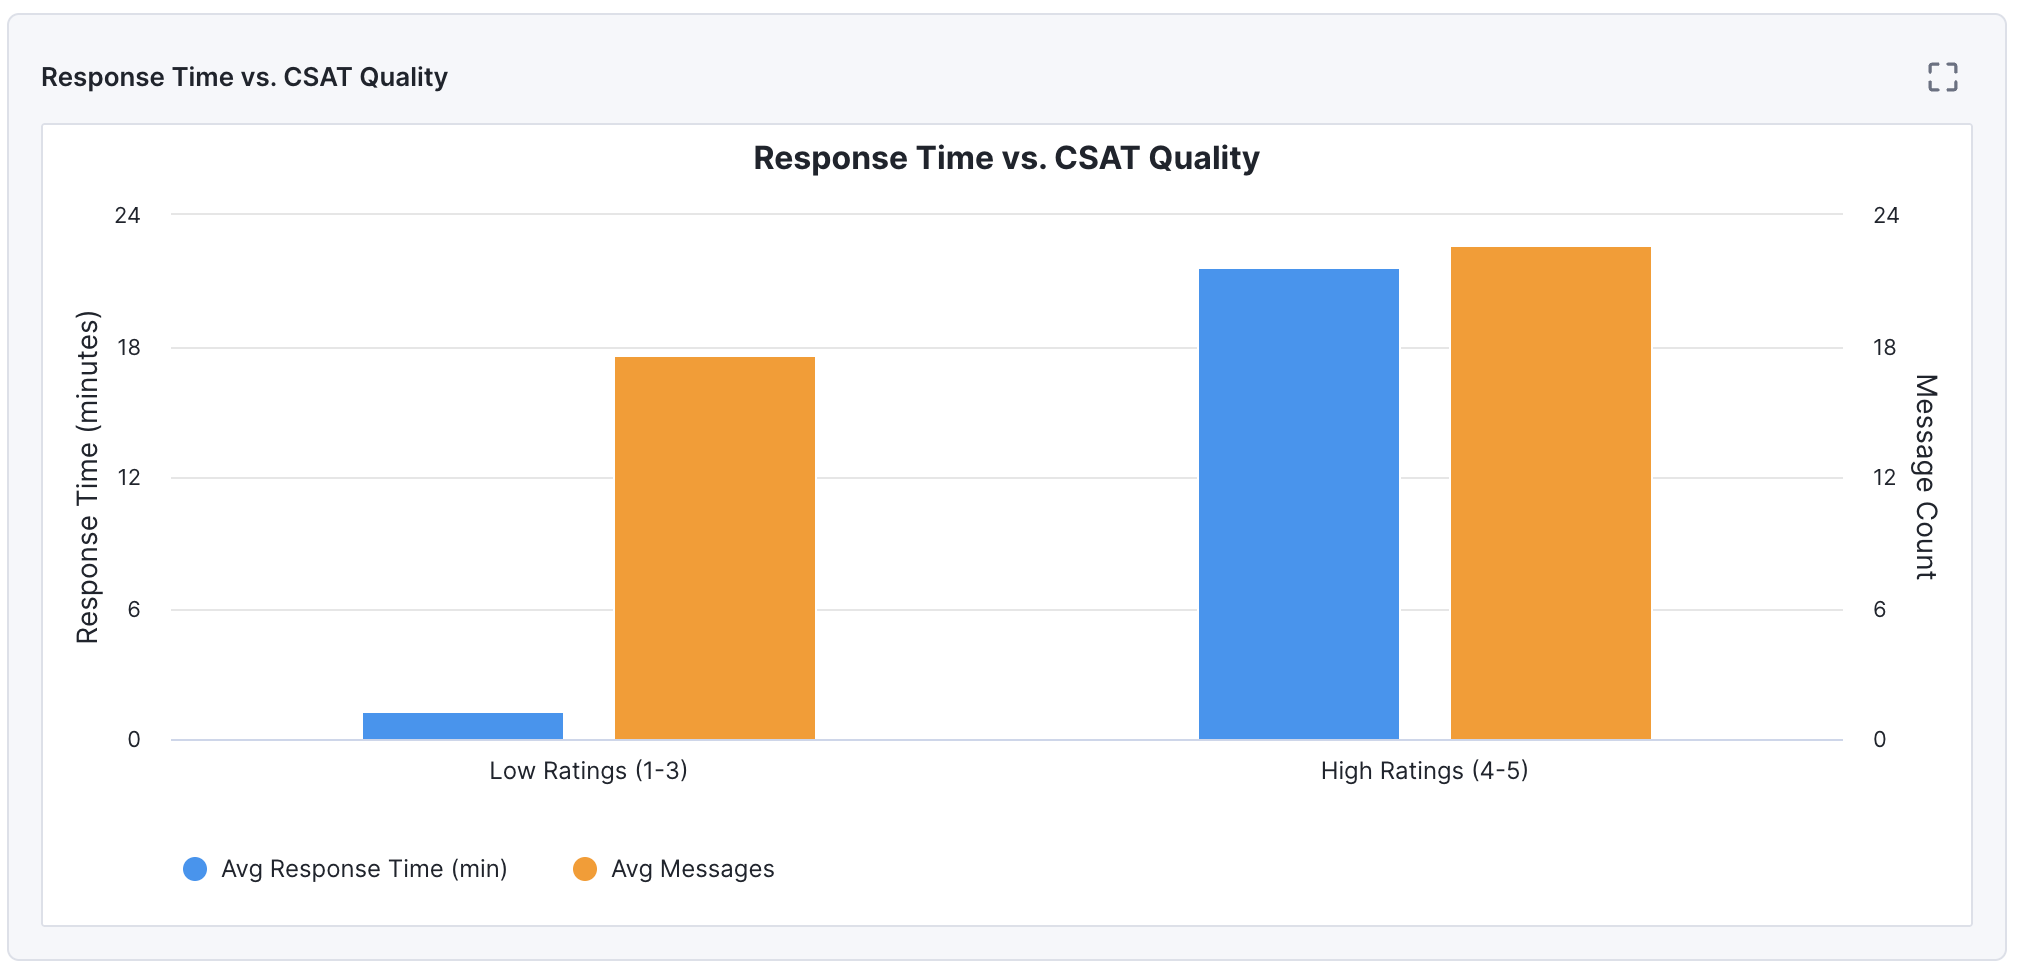
Prompt:
“What is impacting CSAT the most this month, week, or quarter?”
What Data Explorer gives you:
• A view of the key factors influencing satisfaction, such as sentiment patterns, resolution time, and customer history
• Clear explanations that highlight which elements are driving scores up or down
• Insight into how customer experiences differ across issues, channels, or teams
Why it’s helpful:
Understanding what shapes CSAT often requires piecing together multiple sources of data. This prompt identifies the strongest drivers of positive and negative experiences so leaders can focus attention where it will have the biggest impact.
Business impact:
• Helps reduce negative experiences by addressing high-impact drivers
• Supports more accurate planning and prioritization for service improvements
• Strengthens customer loyalty by improving the areas that matter most
Pro Tip:
Follow up with “Which topics or channels have the lowest CSAT this month?” to pinpoint where customer frustration is concentrated.
Day 8: “Compare performance across teams/channels.”
Prompt:
“Compare performance across teams or channels this month, week, or quarter.”
What Data Explorer gives you:
• Side-by-side comparisons of key metrics across teams, channels, or time periods
• Clear explanations highlighting what top performers are doing differently
• Insights that reveal best practices and areas that may need attention
Why it’s helpful:
Benchmarking is often a manual, spreadsheet-heavy task. This prompt gives leaders a clear comparison in seconds, helping them understand performance patterns and identify where improvements or learnings can be shared.
Business impact:
• Helps teams replicate top-performing behaviors
• Highlights areas of variance that may impact customer experience
• Supports better planning, staffing, and coaching across the organization
Pro Tip:
Ask “Which team improved the most this month?” to uncover emerging strengths and positive trends.
Day 9: “Help me optimize staffing.”
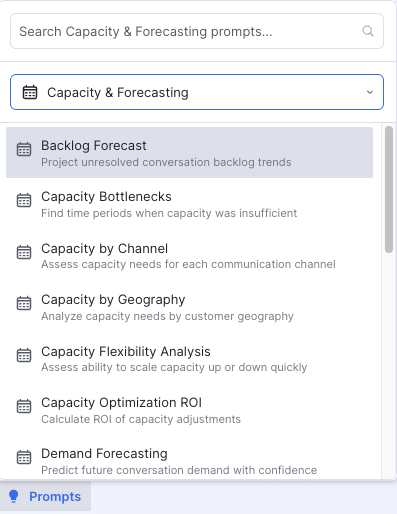
Prompt:
“Help me optimize staffing for this month, week, or upcoming period.”
What Data Explorer gives you:
• Analysis of your busiest hours, channel spikes, and backlog patterns
• Insights into where staffing is too light or too heavy based on recent trends
• Recommendations that factor in historical volume, seasonality, and patterns visible in your capacity library
Why it’s helpful:
Staffing decisions often rely on gut feeling or outdated reports. This prompt highlights exactly when and where demand is highest so leaders can plan more confidently. Including a clear timeframe, such as “this week” or “next month,” produces the most accurate and actionable recommendations.
Business impact:
• Reduces understaffing and overstaffing by aligning resources to actual demand
• Helps prevent SLA risks by preparing teams for peak periods
• Supports more predictable scheduling, budgeting, and operational planning
Pro Tip:
Follow up with “Show me my busiest hours for the upcoming week” to tighten staffing models even further.
Day 10: “Show me unresolved issues that frustrate customers most.”
Prompt:
“Show me the unresolved issues that frustrate customers most this month, week, or quarter.”
What Data Explorer gives you:
• A clear view of recurring issues that remain unresolved and generate the most friction
• Insights into patterns such as escalations, delays, and repeat contacts
• Explanations that help leaders understand which problems have the biggest impact on customer experience
Why it’s helpful:
Unresolved issues often signal deeper operational or product gaps, and they create some of the most frustrating moments for customers. This prompt highlights where these problems cluster so leaders can prioritize what needs attention first.
Business impact:
• Reduces repeat contacts by resolving the issues that cause the most frustration
• Helps improve CSAT by addressing the highest-impact friction points
• Gives teams a clear roadmap for improving the end-to-end customer experience
Pro Tip:
Ask “Which of these issues increased the most this month?” to stay ahead of emerging customer frustrations.
Day 11: “Give me a coaching plan for my lowest-performing agent.”
Prompt:
“Give me a coaching plan for my lowest performing agent this month, week, or quarter.”
What Data Explorer gives you:
• A complete performance review for the selected agent, built from the latest data
• Highlights of the key metrics and behaviors contributing to performance gaps
• A structured coaching plan with clear areas of focus and actionable steps
Why it’s helpful:
Preparing for coaching sessions typically requires gathering data from multiple places. This prompt provides a ready-to-use plan so leaders can spend their time guiding their agents, not compiling information.
Business impact:
• Makes coaching more consistent and effective
• Helps agents improve faster by targeting what matters most
• Supports a culture of development across the organization
Pro Tip:
Follow up with “Show me how this agent has trended over the last three months” to track progress and refine your coaching approach.
Day 12: “What have we improved this year?”
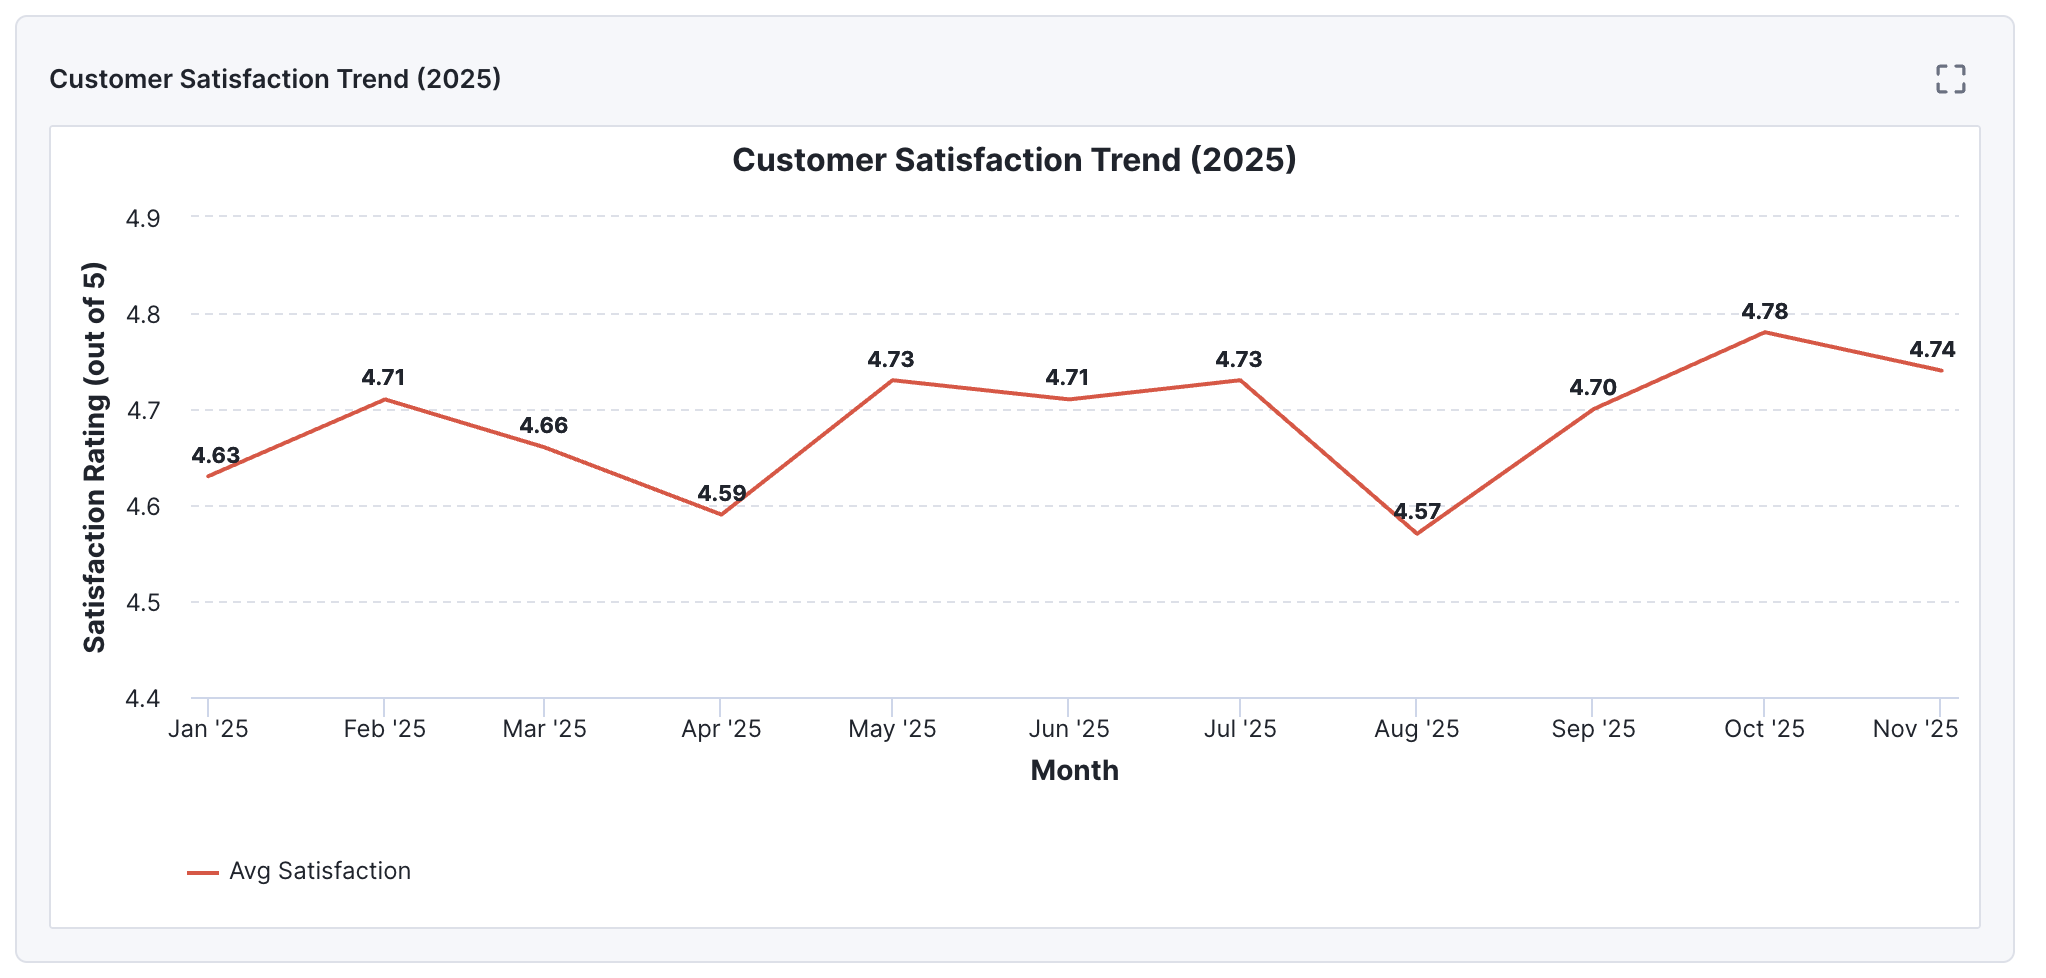
Prompt:
“What have we improved this year? Tell me about the most positive and actionable trends in 2025. Which metrics improved? What are we doing better today than in January?”
What Data Explorer gives you:
• A year-over-year view of the metrics that strengthened the most, such as CSAT, handle time, response time, volume management, or productivity
• Explanations of what contributed to these improvements and where progress was most significant
• Insights that help leaders understand which changes, behaviors, or decisions had the biggest positive effect
Why it’s helpful:
Annual reviews often focus on problems, but celebrating progress can be equally important. This prompt highlights the wins, the improvements, and the areas where the team has meaningfully advanced, giving leaders a clear story to share with stakeholders.
Business impact:
• Reinforces progress and builds confidence across teams
• Supports strategic planning with a clear understanding of what is working well
• Helps leaders identify winning practices that can be scaled or repeated
Pro Tip:
Ask “Which improvements had the biggest impact on customer experience this year” to connect operational gains with customer outcomes.
Closing thoughts
This holiday season, CX leaders don’t need more dashboards. They need answers, explanations, and actionable recommendations. Kustomer’s Data Explorer is the gift that keeps on giving as it transforms every prompt into clarity and every insight into impact.
If you’re already using Kustomer, get started with your first prompts now.
Want to see how Kustomer and Data Explorer can work for your team? Schedule time to chat with our team today.